TL;DR
- ✓345 D365 partners analyzed — employee happiness is a poor predictor of client outcomes.
- ✓Only 35% of partners score well on both Google Maps and Glassdoor simultaneously.
- ✓Company size is the hidden variable — low-Glassdoor partners average 5,000+ employees.
- ✓Management complaints are the #1 red flag at partners struggling on both fronts.
- ✓For D365 buyers, a strong Google rating alone doesn't guarantee a healthy delivery team.
There's a comforting assumption in the Dynamics 365 ecosystem: partners with happy employees deliver better client outcomes. The logic feels airtight — motivated consultants write better code, communicate more clearly, and stick around long enough to see projects through. But does the data actually support this?
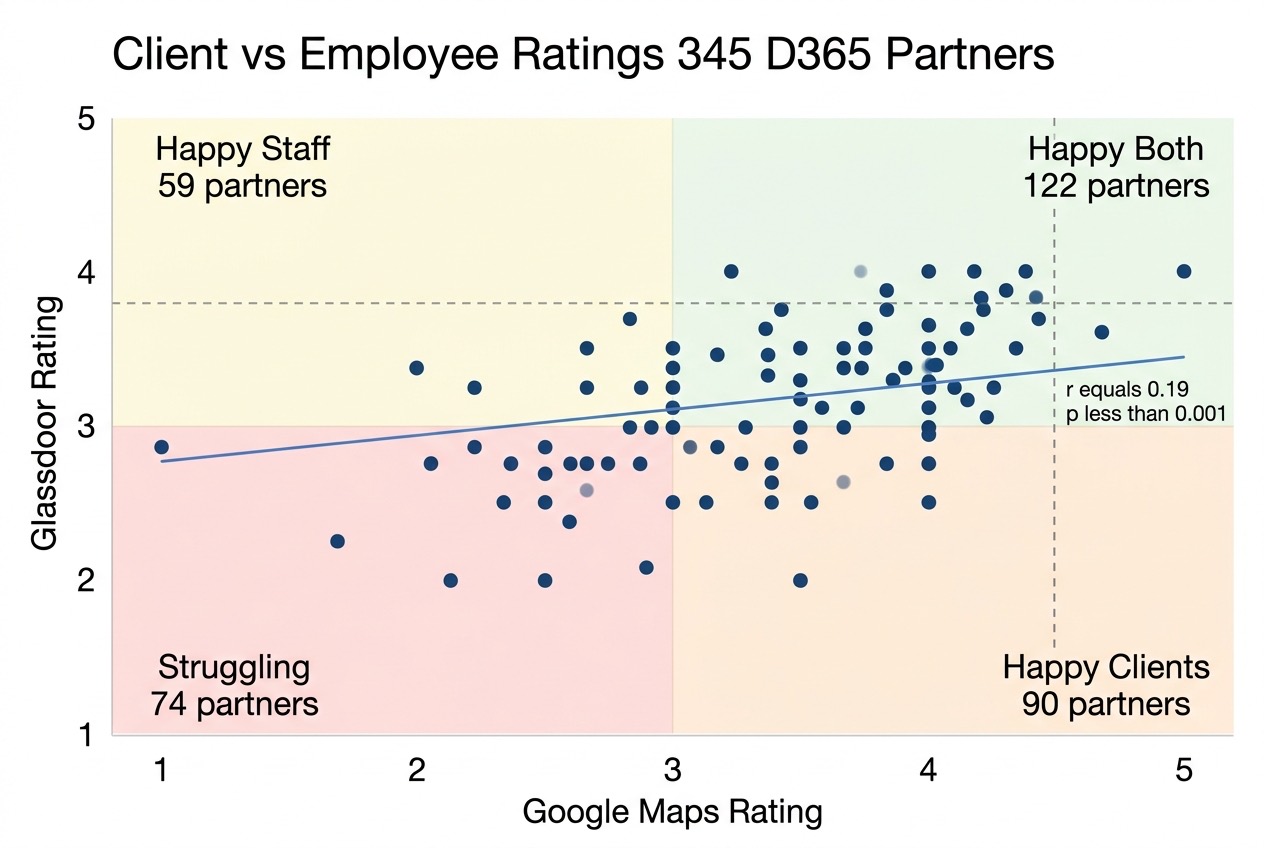
We cross-referenced Google Maps ratings (the client perspective) with Glassdoor ratings (the employee perspective) for 345 Dynamics 365 VAR partners that have reviews on both platforms. The result surprised us: the link between employee satisfaction and client satisfaction is barely there. Happy teams and happy clients overlap far less than you'd expect, and company size turns out to be the variable nobody's talking about.
How Connected Are Client Reviews and Employee Reviews?
Across all 345 partners in our dataset, the connection between Google Maps scores and Glassdoor scores is weak. Knowing a partner's client rating tells you almost nothing about how their employees feel — and vice versa. The two review platforms are measuring fundamentally different things.
To put it in perspective: if client and employee satisfaction were perfectly linked, every partner with great Google reviews would also have great Glassdoor reviews. In reality, only 35% of partners score well on both. The other 65% have a gap — happy clients but unhappy staff, happy staff but lower client scores, or struggles on both fronts.
We also tested whether this gap might be caused by partners with very few reviews skewing the data. It isn't. When we filtered for only partners with at least 10 reviews on each platform (101 partners), the connection was even weaker. More data doesn't strengthen the signal — it dilutes it.
The Four Quadrants: Where Do D365 Partners Actually Fall?
To make the data actionable, we divided partners into four quadrants using the dataset medians as cutoffs: Google Maps ≥ 4.5 (high client satisfaction) and Glassdoor ≥ 3.8 (high employee satisfaction). The distribution tells a more nuanced story than any single rating ever could.
| Quadrant | Partners | % of Total | Avg Employees | Avg Google Reviews | Avg Glassdoor Reviews |
|---|---|---|---|---|---|
| Happy Both | 122 | 35% | 224 | 19 | 37 |
| Happy Staff, Lower Client | 59 | 17% | 236 | 27 | 58 |
| Happy Client, Lower Staff | 90 | 26% | 4,943 | 23 | 87 |
| Struggling Both | 74 | 21% | 5,767 | 118 | 897 |
The most striking pattern: the lower-Glassdoor quadrants are dominated by large companies. Partners in the "Happy Client, Lower Staff" quadrant average 4,943 employees — over 20x the size of "Happy Both" firms. Partners struggling on both fronts average 5,767 employees. This isn't a coincidence. It's the dataset's most important finding.
The Size Effect: Why Large Partners Score Lower on Glassdoor
Company size is the single most important factor hiding behind these numbers. The average Google Maps and Glassdoor ratings are nearly identical for small and large partners — but where they land in the quadrants is dramatically different.
| Quadrant | Small Partners (<500) | Large Partners (500+) |
|---|---|---|
| Happy Both | 38% | 31% |
| Happy Staff, Lower Client | 17% | 13% |
| Happy Client, Lower Staff | 25% | 23% |
| Struggling Both | 19% | 33% |
Large partners are nearly twice as likely to land in the "Struggling Both" quadrant (33% vs 19%). It's not that large firms deliver worse client work — their average Google Maps ratings are actually slightly higher. But Glassdoor reviews at scale reflect the full spectrum of employee experience. A 5,000-person consultancy has hundreds of Glassdoor reviews, capturing everything from disgruntled former employees to happy long-tenured staff. A 100-person VAR might have 10, skewing toward founders and early employees who self-selected into the company.
This mirrors what we found in our Size-Satisfaction Paradox analysis — smaller D365 partners consistently score higher on both review platforms, not necessarily because they're objectively better, but because their review profiles are structurally different.
What Clients Say: Review Themes by Quadrant
We analyzed the client-facing review themes (extracted via AI sentiment analysis from Google Maps reviews) across each quadrant. The pattern reveals what differentiates partners who score well with clients — regardless of their Glassdoor situation.
| What sets "Happy Both" partners apart | Mentions |
|---|---|
| Professionalism — clients describe teams as polished and well-organized | 38 |
| Technical Expertise — deep D365 knowledge comes through in reviews | 33 |
| Responsiveness — fast replies and proactive communication | 21 |
| Reliability — projects delivered on time and as promised | 17 |
The flip side: at partners struggling on both fronts, communication issues and slow support responsiveness are the recurring client complaints. When delivery breaks down, clients point to communication, not technical capability.
This aligns with what our Content Marketing Gap analysis found: clients consistently cite communication as the make-or-break factor in D365 engagements, even though partners rarely discuss it in their own marketing.
What Employees Say: The Management Red Flag
The employee side of the equation tells an even more compelling story. We analyzed Glassdoor review themes extracted from each partner's employee reviews. The differences between quadrants are stark.
| "Happy Both" — What employees praise | Mentions |
|---|---|
| Company Culture — strong values and team identity | 16 |
| Work-Life Balance — sustainable workloads | 11 |
| "Struggling Both" — What employees complain about | Mentions |
|---|---|
| Management Style — poor leadership and decision-making | 43 |
| Career Growth — limited advancement opportunities | 29 |
| Job Security — layoff fears and instability | 20 |
Management complaints are the #1 negative theme in the "Struggling Both" quadrant by a wide margin — 43 mentions, nearly double the next-highest complaint. Partners struggling on both fronts don't just have unhappy employees; they have employees who specifically point to management as the problem. This is the clearest warning signal in the entire dataset.
Meanwhile, "Happy Staff, Lower Client" partners stand out for learning opportunities and career growth. These may be firms that invest heavily in employee development but haven't translated that internal strength into client-facing execution. The disconnect is fascinating: great to work for, but their clients don't see the benefit yet.
What This Means for D365 Buyers Evaluating Partners
If you're selecting a Dynamics 365 implementation partner, this data has three practical implications:
1. Don't use Glassdoor as a proxy for delivery quality. A Glassdoor rating of 3.5 at a 5,000-person firm is structurally different from a 3.5 at a 50-person firm. The link between employee ratings and client ratings is too weak to be predictive. Use Glassdoor for what it's designed for — understanding the employee experience — but don't assume it predicts your project outcome.
2. Look for the dual red flags. When a partner has both low Google Maps scores and low Glassdoor scores, that's a genuine warning sign. Our data shows these partners are overwhelmingly large firms where employees cite management dysfunction and lack of career growth. These are the partners most likely to churn senior consultants mid-project — which directly impacts delivery.
3. Check the review themes, not just the numbers. A 4.2-star Google rating could mean consistently good work, or it could mean a mix of 5-star and 2-star reviews. The themes tell you what's actually happening. If clients praise professionalism and responsiveness, you're likely looking at a well-run delivery team. If they're flagging communication issues, that's a process problem that no amount of technical talent will fix.
What This Means for D365 Partners Managing Their Employer Brand
For VARs and consultancies, the data points to a more nuanced employer brand strategy than "happy employees = happy clients."
"Happy Both" partners prove it's possible to win on both fronts — but they're almost exclusively smaller firms (average 224 employees) where culture, company leadership, and technical expertise are tightly coupled. If you're in this quadrant, protect it. The data suggests that scaling past a few hundred employees introduces structural challenges that pull you toward the lower-Glassdoor quadrants.
"Happy Staff, Lower Client" partners have an underutilized asset. Your employees are happy. They cite career growth, learning opportunities, and a positive work environment. But clients aren't seeing the same excellence. The gap might be a marketing problem (your good work isn't visible) or a delivery process problem (the employee experience doesn't translate to the client experience). Either way, the foundation is there — you just need to bridge the gap.
For deeper analysis on how Glassdoor ratings relate to client outcomes, read our companion piece: The Glassdoor Red Flag: When Your D365 Partner's Employees Are Unhappy, Should You Worry?
How Reliable Is This Data?
Before drawing conclusions, it's worth understanding the review volume behind these ratings.
| Review Count Range | Google Maps Partners | Glassdoor Partners |
|---|---|---|
| Under 5 reviews | 115 (33%) | 90 (26%) |
| 5–19 reviews | 127 (37%) | 93 (27%) |
| 20–49 reviews | 63 (18%) | 71 (21%) |
| 50+ reviews | 40 (12%) | 91 (26%) |
A third of partners have fewer than 5 Google Maps reviews, which means their client rating is based on a very small sample. Glassdoor data is more evenly distributed — 26% of partners have 50+ employee reviews, providing a more stable signal. For the most reliable comparison, focus on partners with at least 10 reviews on each platform.
Frequently Asked Questions
Is there a link between employee satisfaction and client satisfaction at D365 partners?
Barely. Our analysis of 345 Dynamics 365 VAR partners found that Google Maps ratings (client perspective) and Glassdoor ratings (employee perspective) are only weakly connected. Only 35% of partners score well on both platforms — meaning the majority have a gap between how clients and employees rate them.
Should I check a D365 partner's Glassdoor reviews before hiring them?
Glassdoor reviews provide useful context but should not be your primary selection criterion. The link between employee and client satisfaction is too weak to be predictive. Instead, use Glassdoor to look for specific red flags — especially management-related complaints, which are the strongest negative signal in our dataset. Combine this with Google Maps reviews, case studies, and direct reference checks.
Why do larger D365 partners tend to have lower Glassdoor scores?
Partners in the lower-Glassdoor quadrants average 4,943–5,767 employees compared to 224 for the highest-rated quadrant. Larger firms accumulate more reviews from a wider range of employees — including those in non-consulting roles, different office locations, and various tenure levels. This creates a more representative but often lower average. It's a structural feature of review platforms, not necessarily evidence of worse working conditions.
What is the biggest red flag in D365 partner employee reviews?
Management style complaints are the clearest danger signal. In our data, partners struggling on both client and employee fronts had 43 mentions of negative management themes — nearly double any other complaint category. When employees specifically cite poor management, it often correlates with consultant turnover, which directly impacts Dynamics 365 project delivery continuity.
Can a D365 partner have happy clients but unhappy employees?
Yes — and it's more common than you might expect. 26% of partners in our dataset (90 firms) fall into the "Happy Client, Lower Staff" quadrant. These are predominantly large firms (average 4,943 employees) that deliver well for clients but face internal challenges around team management and career development. The client-facing teams may be strong even when the broader organization has cultural issues.
How many Dynamics 365 partners have both Google Maps and Glassdoor reviews?
In our dataset of active VAR and mixed-type D365 partners, 345 have reviews on both platforms. The average partner in this group has 42 Google Maps reviews and 238 Glassdoor reviews, providing a substantial base for analysis.
Methodology
Dataset. We analyzed 345 Dynamics 365 partners listed in the Top Dynamics Partners directory that had reviews on both Google Maps and Glassdoor as of March 2026. The dataset was restricted to partners with a dynamics_partner_type of "var" or "mixed" (343 VAR, 2 mixed) to focus on implementation partners rather than ISVs or consultancies without direct client delivery.
Data collection. Google Maps ratings and review counts were sourced from the Google Places API. Glassdoor ratings and review counts were collected via web scraping. Both were stored in the review_sources_summary field of each partner's listing record. Client and employee review themes were extracted using AI-powered sentiment analysis which tagged recurring themes with labels and sentiment polarity.
Analytical approach. We used Pearson correlation to measure the linear relationship between Google Maps and Glassdoor ratings. The overall correlation was r = 0.19 (t = 3.54, p < 0.001) — statistically significant but weak, explaining just 3.5% of the variance between the two ratings. When restricted to partners with at least 5 reviews on each platform (n = 174), the correlation weakened further to r = 0.13; at 10+ reviews each (n = 101), it remained at r = 0.13. The quadrant analysis used dataset-approximate medians as thresholds: Google Maps ≥ 4.5 for high client satisfaction and Glassdoor ≥ 3.8 for high employee satisfaction. Size-controlled analysis split partners at the 500-employee threshold (small: r = 0.19, n = 275; large: r = 0.22, n = 39).
Limitations. Google Maps reviews are a self-selected sample — people who leave reviews chose to do so voluntarily, and those with very strong experiences (positive or negative) are more likely to post than those with average ones. This means review data may over-represent the extremes and should not be read as a statistically representative survey of all client experiences. Glassdoor reviews carry the same self-selection bias, compounded by the fact that current and former employees have different motivations for reviewing. Google Maps reviews may also include non-D365-related work (e.g., other Microsoft products, general IT services). Correlation does not imply causation — we cannot conclude that employee satisfaction causes better client outcomes or vice versa. The review theme analysis relies on AI classification, which introduces a layer of interpretation uncertainty. Finally, 33% of partners in the dataset have fewer than 5 Google Maps reviews, meaning their client rating is based on a very small sample.
Data currency. This analysis reflects data as of March 2026. Review counts and ratings change continuously as new reviews are posted. Material changes in the dataset will be reflected in future updates to this analysis.